Posts

Showing posts from November, 2014

DALMOOC episode 8: Bureau of pre-learning

Image
I see a lot of WTF behavior from learners. This is bad... or is it? Oh hey!  It's week 6 in DALMOOC and I am actually "on time" this time!  Even if I weren't it's perfectly OK since there are cohorts starting all throughout the duration of the MOOC (or so I suspect), so whoever is reading this: Hello! This week the topic of DALMOOC is looking at behavior detectors (types of prediction models).  Behavior detection is a type of model (or types of models) that we can infer from the data collected in the system, or set of systems, that we discussed in previous weeks (like the LMS for example).  Some of these are behaviors like off-task behavior such as playing candy crush during class or doodling when you're supposed to be solving for x . Other behaviors are gaming the system, disengaged behaviors, careless errors, and WTF behaviors (without thinking fastidiously?  or...work time fun? you decide ;-) ). WTF behavior is working on the system but not the task

DALMOOC episode 7: Look into your crystal ball

Image
Whooooa! What is all this? Alright, we're in Week six of DALMOOC, but as usual I am posting a week behind.  In previous weeks I was having a top of fun playing with Gephi and Tableau. Even thought the source material wasn't that meaningful to me I was having fun exploring the potential of these tools for analytics. This week we got our hands on Rapidminer a free(mium) piece of software that provides an environment for machine learning, data mining and predictive analysis.  Sounds pretty cool, doesn't it?  I do have to say that the drag and drop aspect of the application does make it ridiculously easy quickly put together some blocks to analyze a chunk of data. The caveat is that you need to know what the heck you are doing (and obviously I didn't ;-) ).  I was having loads of issues navigating the application, and I somehow managed to not get some windows that I needed in order to input information to, and I couldn't find where to find the functions that I

Designing in the Open (and in connected ways)

Image
Wow, hard to believe, but we've reached the final module of Connected Courses (and boy is my brain tired!).  I found out last week that there may be a slim chance of me being able to teach Introduction to Instructional Design (INSDSG 601, a graduate course) at some point in the new future. This is something that was offered to me a couple of summers ago, but being away on vacation at the time (with questionable internet access) it didn't seem like a good idea to be teaching an online course. I've been poking around the course shell, here and there, over the past couple of years (even since teaching this course was a remote possibility) to get ideas about how to teach the course.  The previous instructor, who had been teaching this course for the past 10 years but recently refocused on other things, did a good job with the visual design of the course. It's easy to know what you are are supposed to do each week.  Then again, from the design of the course I can see th

Attack of the untext - my own stumbling blocks

Image
It's been a while since Rhizo14 ended, but the community is going strong! Facebook may not be as active (or maybe facebook is  hiding most Rhizo posts from my timeline...that could be it...anyway), but we are still chugging along with the collaborative *graphy. I can't call it an ethnography, or autoethnography because variables have changed.  Some of us decided to get together and write an article for Hybrid Pedagogy on why the Collaborative *graphy article is taking so long (a meta-article if you will) but we got stuck there too (or it seems as though we are stuck).  I think others have written about their own personal views on this on their own blogs, so I've been working out what my own stumbling blocks are with this project. I think I have a way to explain things now! So, when working collaboratively in previous collaborative work situations your final product feel unified.  The main analogy that I can give give is the main root of one plant which looks like this:

DALMOOC episode 6: Armchair Analyst

Image
Week 6 CCK11 blog connections I was trying for a smarter title for this episode of #dalmooc thoughts, but I guess I have to go with Armchair Analyst since I ended up not spending a ton of time with either Gephi or Tableau last week. So, the reflection for week 4 is mostly on theoretical grounds; things I've been thinking about (with regard to learning analytics) and "a ha" moments from the videos posted. I think week 3 and week 4 blend together for me.  For example, in looking at analytics the advice, or recommendation, given is that an exploration of a chunk of data should be question driven rather than data-driven.  Just because you have the data it doesn't necessarily mean that you'll get something out of it.  I agree with this in principle, and many times I think that this is true.  For instance, looking back at one of our previous weeks, we saw the analytics cycle.  We see that questions we want to ask (and hopefully answer) inform what sort of data w

DALMOOC episode5: Fun with Gephi

Image
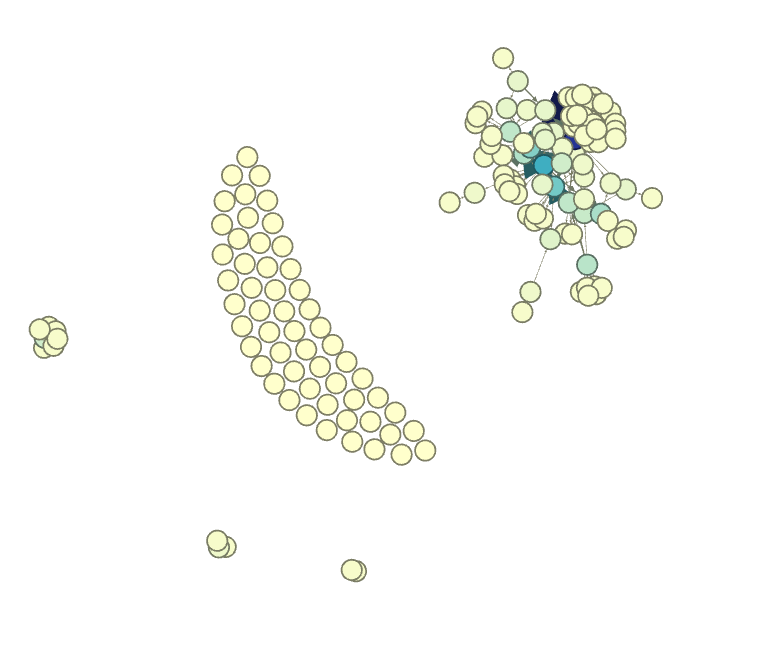
CCK11 Tweet visualization Alright, after a few days of being sidelined with a seasonal cold, I'm back on #dalmooc.  Still catching up, but I have a feeling I am getting closer to being at the same pace as the rest of the MOOC ;-)  In any case, this is a reflection on week 3 where we started messing around with social network analysis (SNA).  This is cool because it's something that I had started doing on another MOOC on coursera, with Gephi, so it was an opportunity to get back on and messing with the tool. So, what is SNA?  SNA is the use of network theory to analyze social networks.  Each person in this network is represented by a node (or edge), and nodes  can be connected to other nodes with a vertex (or many vertices). These connections can indicate a variety of things (depending on what you are examing), however for my usage in educational contexts I am thinking of vertices as indicators of message flow, who sends messages to whom in a network, and also who refers

Questions about Co-Learning

What do you get when you mix connected courses, thinking about academia, and cold medicine?  The answer is a blog post (which I hope makes sense) :-) As I was jotting down my initial thoughts on co-learning in the previous post I completely forgot to address some of the initial thinking questions for this module.  Here are some initial thoughts on co-learning and how I would address these questions: What is co-learning and why employ it? For me co-learning is when two or more people are working together to solve a problem and learn something new.  As I wrote in my previous post, the individuals in this community do not all need to start from the same point. There can, and will, be learners that are more advanced in certain areas as compared to others.  This is perfectly fine, and it's realistic to expect this.  This can be a community of practice, it can be a broad network of learning, or a loosely connected network of learning that centers around a hashtag.  The reason to co

Active Co-Learning

I took a small hiatus from Connected Courses in the last module because everything sort of piled on at the same time and  I had little space to breathe.  Yes, I've been dalmoocing, so I guess everything is a choice ;-).  I guess that was my jump-out week of connected courses, and now I am dipping in again. I love the language of cMOOCs ;-)  The truth is that I've felt a little fatigued with #ccourses.  I am not sure if it's the length, or the time I've been engaged with it (7 weeks if you consider the pre-course and that's before we got to Diversity, Equity, and Access ), so I guess I needed a little mental break.  I don't think this is an issue unique to MOOCs because I've been feeling a mild case of senioritis in my first EdD course. Luckily I've done all of my deliverables, submitted them, and have gotten feedback, so now I am participating with my peers and engaging in the participation aspect of the course. Anyway, these next two weeks are ab

Teachers on Wheels

An interesting documentary shared by one of my EdD classmates.

MOOCs in a nutshell (assignment for class)

One of the things that has been keeping me busy this semester has been my inaugural semester as a Doctoral student at Athabasca University's Center for Distance Education.  The semester isn't over yet,but I am slowly working at hammering out some assignments for the course.  I've tried to be pro-active so that I can get the foundational reading done early in the semester so I can focus on reading some additional articles on MOOCs that have been on my to-read pile for a while.  I ended up getting all the readings done (the ones assigned by the faculty anyway), but I've been side-tracked reading interesting things that my classmates post :-) In any case, for the third assignment for my inaugural class I looked at MOOCs (no surprises there), and I discussed very briefly the historical overview of MOOCs (keep an eye out in December for the special issue of the CIEE journal, some good articles coming out on the topic of MOOCs), I discussed a bit some work I am doing with a

DALMOOC, Episode 4: policy, planning, deployment and fun with analytics

Image
Continuing with my exploration of DALMOOC, we've reached the end of Week 2 (only a few days late ;-)  ).  I've been playing with Tableau, which I can describe as Pivot Tables on steroids.  I briefly explored the idea of getting some IPEDS data to mess around with, however that proved to be a bit more challenging than I had anticipated. So, I ended up using the sample data of course evaluations to figure out how to work Tableau.  The following are some interesting visualizations of the data that I had: The one thing I realized, as I was playing around with the data, is that it's really important to really know what your data means.  I thought I knew what the categories meant, because I thought that institutions of higher education used similar lingo.  The more I played with the data, the more I realized that some things weren't what I was expecting them to be.  Thus, in order to know what is being described and portrayed through the visualizations one needs to

DALMOOC episode 3: Screenchomping the analytics cycle description

I've had this app on my iPad, by TechSmith, for the past few years, but I've never really used it.  The App is called ScreenChomp and it allows you to have a digital whiteboard that you can use to write and narrate.  I through that a plain text description of the learning analytics cycle (still catching up on week 2 of DALMOOC) would probably be confusing, and using PowerPoint and Adobe Presenter would be too static.  So, I applied the learning analytics cycle to a course I teach, and I decided to hand-write everything. Heck I attempted to draw as well, but my lack of artistic talent shows ;-) Direct link to the screenchomp (if the embed doesn't work):  http://www.screenchomp.com/t/qE1lplho DALMOOC Week 2, Description of the Data Analytics Cycle from Apostolos K. on Vimeo . How does this cycle apply to your courses?

DALMOOC, episode 2: Of tools and definitions

Image
My Twitter Analytics, 10/2014 Another day, another #dalmooc post :)  Don't worry, I won't spam my blog with DALMOOC posts (even if you want me to), I don't have that much time.  I think over the next few days I'll be posting more than usual in order to catch up a bit.   This post reflects a bit of the week 1 (last week's) course content and prodding questions. I am still exploring ProSolo, so no news there (except that I was surprised that my twitter feed comes into ProSolo.  I hope others don't mind seeing non-DALMOOC posts on my ProSolo profile. Week 1 seemed to be all about on-boarding, of tools and definitions.  So what is learning analytics?  According to the SOLAR definition, "Learning Analytics is the measurement, collection, analysis, and reporting of data about learners and their contexts, for purposes of understanding and optimizing learning and the environments in which it occurs." It's a nice, succint, definition - which I had